 At Leaseweb, our CDN team focuses on delivering ultra-high performance globally for any content while remaining the most competitive player in the field. We process and monitor millions of requests per minute and that level of traffic requires a robust and flexible statistics platform that provide us and our customers with real-time accurate information.
Our previous statistics platform had several issues that didn’t allow us to get the most accurate picture of what was happening. The data was analyzed on the content-serving edge nodes. In order to consume as little resources on these nodes as possible, the data was sampled instead of counting every hit. The result was an approximation rather than an exact number. Another issue was resilience: the old platform had stability issues that might result in inaccuracies. We needed something that was reliable, wouldn’t consume edge-node resources, would record every hit, and would provide instantly precise counts for us and our customers.
Our goals for the new platform were as follows:
- Real-time statistics. This is easier said than done with several hundreds of machines producing 60,000 log lines per second (200 million per hour). We wanted to build future-proof systems to be able to handle at least ten times as much load.
- Open-source components – we wanted to use tested and proven tools. Recent developments in horizontally scalable systems by the Apache Kafka and Cassandra DB projects addressed our needs for this project.
- Horizontal scalability – we wanted to be able to quickly and seamlessly add hardware capacity.
- Relieve resource load on the edge-nodes by moving the processing to a separate cluster. The only process needed would be a simple log reader that would send the data to a cluster. This would ensure maximum performance at all times.
- High-availability clusters to ensure there is no loss of data collection with a minimum of three hosts.
- Geo-redundancy – the platform would run in multiple data centers so that the loss of a location would not result in an outage.
With these goals in mind we decided on the following architecture, calling the project Apollo:

The edge nodes run the Apollo Log Reader which sends the log lines to the Apache Kafka Message Queue cluster. From there the log lines are sent to the Apollo Agent cluster to process the data. Each Apollo Agent host has a manager which spawns and checks the Agent processes. These Agents consume the log lines sent from the Kafka cluster, update the counters in Cassandra DB, and process the data for a specific type of statistic, depending on the type of agent it is. Different agent types retrieve different types of statistics from a log line.
Some of these types typically include:
- Traffic / bandwidth: the number of hits per second, number of bits per second.
- Cache offload: how many hits/bits are served by our CDN, offloading client’s web servers.
- Geo: where the client’s users are located.
The Agents are built to be horizontally scalable. If additional capacity is needed more Agents can be spawned to meet the demand. Fault tolerance is addressed in a number of ways: Any failed queries are saved to disk and re-executed later. If an agent fails, it will respawn. If all of the agents on a host stop running, the agents on other hosts will take over.
To view all of this data we are collecting we created monitoring tools using Prometheus and Grafana. These graphs display such information as:
- Load (activity) of machines
- Error rates of applications
- Global traffic
- Top customers
- Recency of statistics per edge, so we know when an edge stops sending log data to our platform for any which reason.
For Kafka we wanted to look at multiple data points. Our ingest and throughput graph is used to get a general idea of the total amount of log lines that are processed by the Kafka cluster. It also allows us to check whether the Agents are able to keep up with the log lines that are sent to Kafka. If not, we’ll spawn more agents.

To monitor lag, we have our mean and max graph. If these lines diverge that means that some agents process data faster than others. That would cause certain Kafka partitions to contain many unprocessed log lines, while other partitions are empty.

In order to stay in top of potential trouble spots, our graphs are constantly displayed on monitors in the office. This way, we can immediately detect any anomalies and investigate as needed. This has helped us to detect minor issues and solve them before they become bigger problems that could lead to outages.
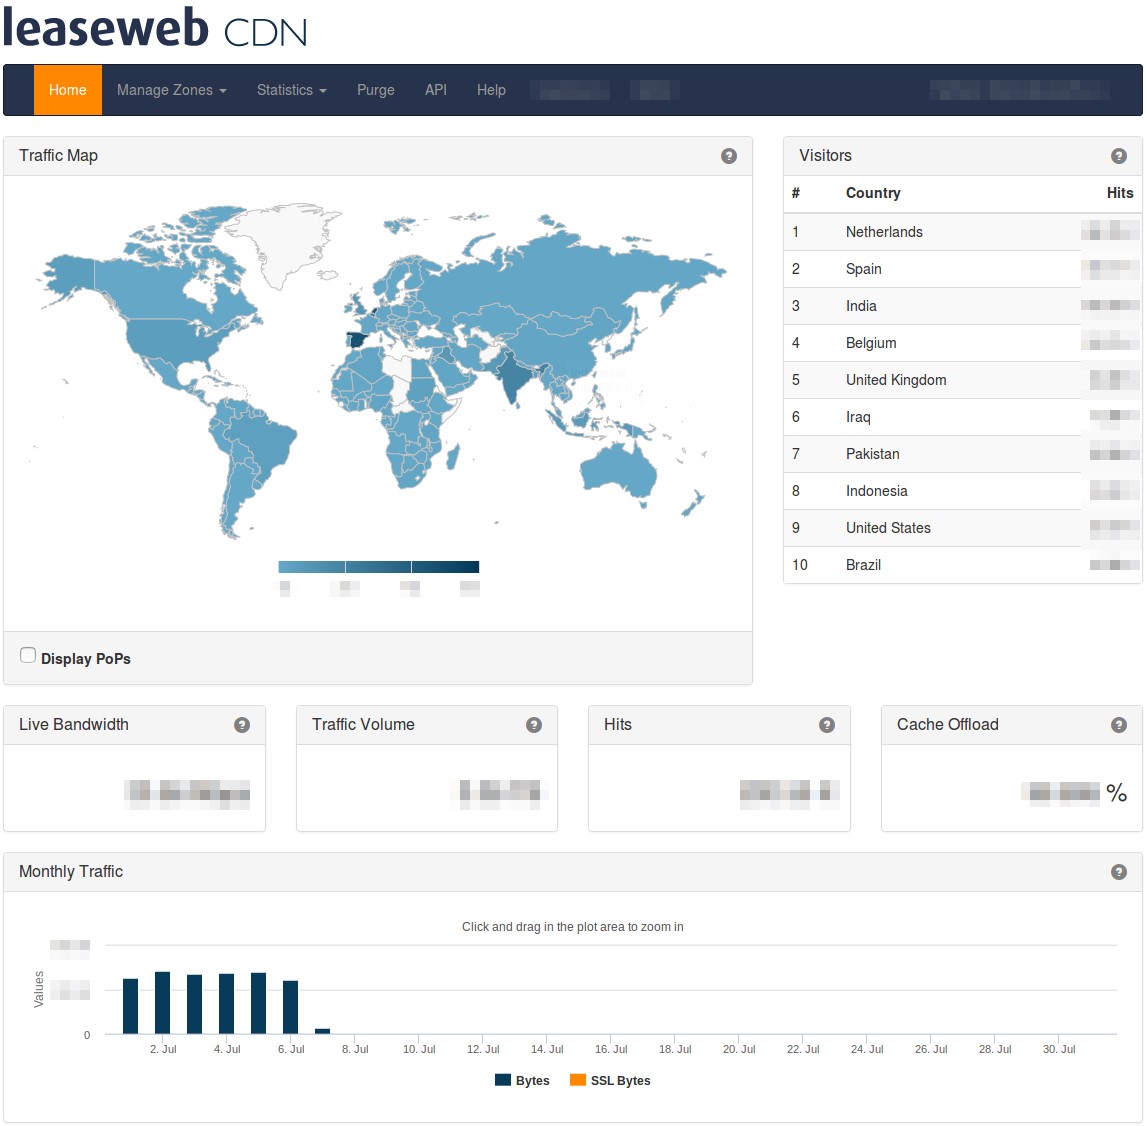
Thanks to this new platform, we improved greatly our dashboard in term of speed, real-time delivery of data and intelligence on the end-user experience.
They can drill down into each statistic for more details. Here we show the traffic volume during a specified time period:

This graph shows the customer the cache offload statistics:

After building, testing, migrating data, and documenting the new Apollo platform went live in May. Our next steps will be to add more Kafka clusters globally to decrease bandwidth usage as well as dedicated Agents for sending aggregated data. Future plans also include offering additional statistics for data types such as operating systems, browsers, HTTP errors, and unique visitors.
Re-architecting a system as critical as the statistic platform required many months of development, testing, and migrating the data from previous architecture, but we are very proud of the accomplishment and all customers are benefiting from it. As our traffic continues to grow at a rate of about 5% per month we are aware that we have just laid the foundations to meet our needs for massive scaling. If you are interested in helping us, we are actively hiring for this work.